
Design, analysis, and optimization of thermal systems and components based on simulation methods developed and tested over many years
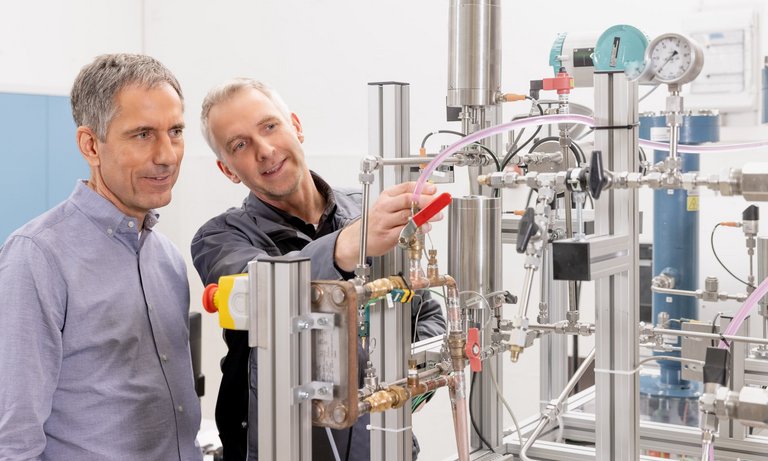
Measurement of components and systems carried out on specialized test benches in a modern 1500 m² laboratory
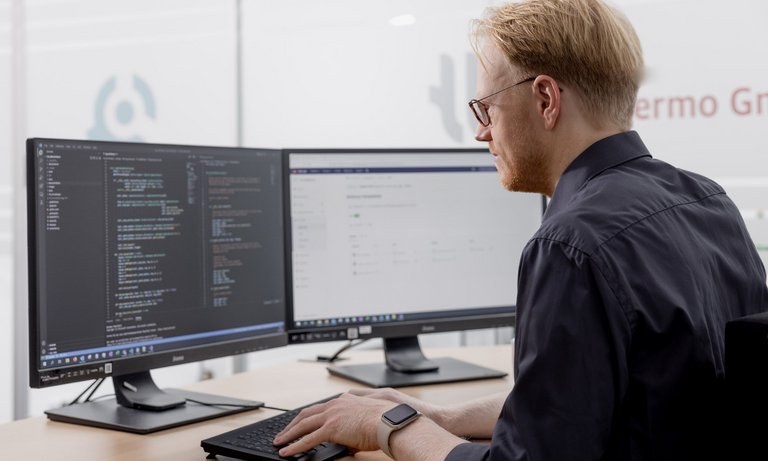
Nine versatile products for physical modeling, simulation, visualization, automation, co-simulation, and model exchange